Cordova Extension for VSCode
There’s been a lot of well-deserved buzz around VSCode, Microsoft’s new lightweight editor. VSCode is becoming a solid choice as an editor for numerous reasons.
- It’s cross platform: Mac, Windows, and Linux
- It’s built on web technologies: Uses Electron as its core
- It’s hackable: You can build extensions using JS/TS
- It’s lightweight: Fast startup time; nice and snappy
If you’re using any other lightweight editors, you might want to consider VS Code, too. It has a lot of great defaults set up for web development. On top of all that, it’s free and open source!
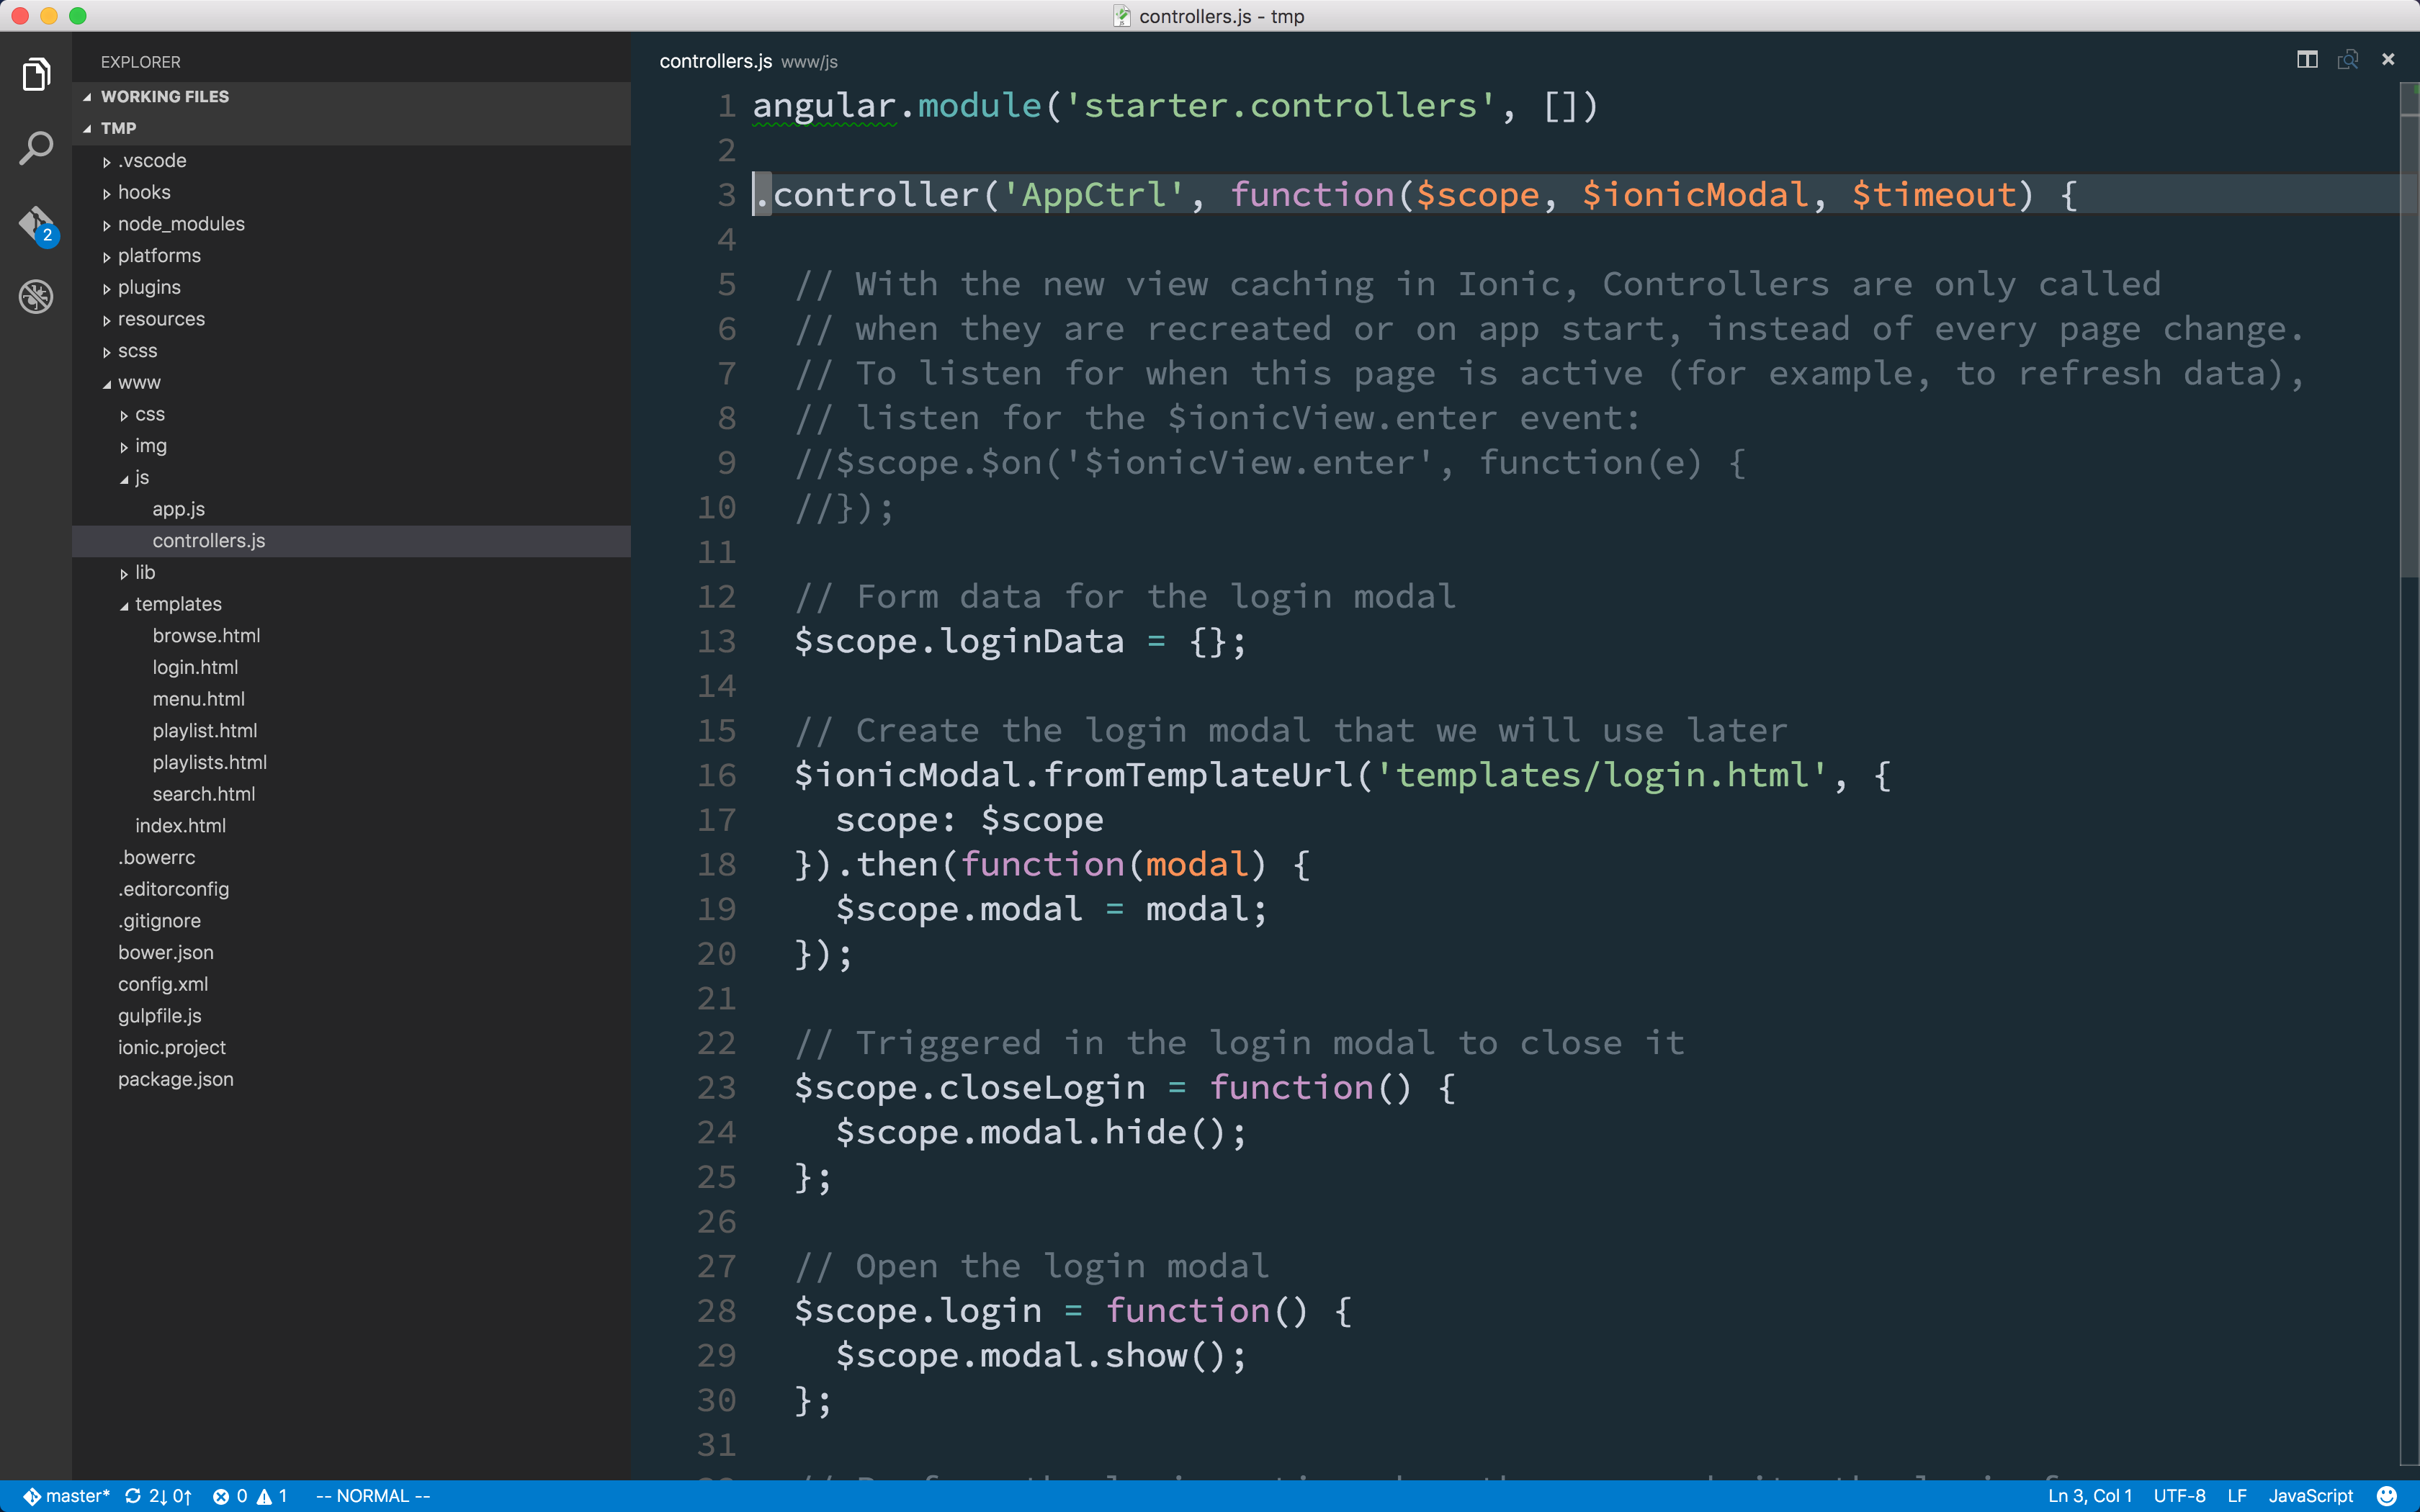
One feature in particular that has blown me away is the Cordova extension that has been released.
This extension provides two big features: code IntelliSense for all the raw Cordova plugin APIs, and debugging capabilities.
IntelliSense
Normally, JavaScript code hinting tools tend to be hit or miss. They work really well when using the raw DOM API, but if you try to use a library or a set of plugins, the code hints break. They don’t know about those additional APIs, so they can’t provide any meaningful feedback. This is where the first feature of the Cordova extension really helps.
Behind the scenes, when you open a project in VSCode, the extension will check to see what Cordova plugins you have installed for your project. From there, it will fetch the proper type definition files. You may be thinking, “But I thought type definition files were for Typescript only?”, and you’d be partially correct.
VSCode can use those type definition files to analyze your JavaScript and provide meaningful hints about the APIs.
This is great for those who don’t necessarily want to use TypeScript but still want code hinting for the plugins.
Debugging
It used to be tricky to debug a Cordova app. While you could debug most of your app in the browser, debugging native plugin calls required the code to be on a physical device, and then you had to attach either the Chrome or Safari devtools. This could mean you missed logs or warnings that got fired, or you had to figure out how to reload the app and attach breakpoints.
Enter VSCode’s debugger!
The debugger in VSCode is a full featured devtools debugger right inside your editor. It also allows you to deploy to both a simulator or physical device, or attach to an already running process.
But by far the most powerful feature of this is that as you write your code, you can set breakpoints inside your editor and have those breakpoints work on your device without any issues.
This is huge! Now we can enjoy the experience of developing and debugging our hybrid apps.
This works not only with pure Cordova projects, but with Ionic projects, too. Pair that with VSCode’s excellent Angular code IntelliSense, and you have a development experience like no other. I encourage everyone to give VSCode a try and test out the extension.